I used SSIS SharePoint List source and destination to publish a SharePoint list of employees, combining data from a internal database source as well as active directory.
At some point, I noticed that the returned column from a ssis lookup returned null value.
I did notice though the lookup transformation was working at first time and the default options have 'full cache' turned on. this post a reasonable doubt that the issue might be caused by caching. after turned it off, the result is now normal.
Friday, April 15, 2011
Sunday, April 10, 2011
high PAGEIOLATCH_SH in transactional replication?
it turned out that when setting up replication, the default behavior is to remove nonclustered indexes.
Friday, April 8, 2011
SQL Server Wait Events: Taking the Guesswork out of Performance Profiling
SQL Server Wait Events: Taking the Guesswork out of Performance Profiling
by Mario Broodbakker
Dude, Where's my Time?
Measuring what is actually happening is always the best course of action when investigating performance issues on databases, rather than relying on cache hit ratios, or best practices, or worst of all, guesswork.
In order to solve performance issues, you may take a gamble on buying a bigger box with the fastest CPUs, only to discover that it doesn't achieve anything. Understanding and measuring is the key to improving database performance. If, for example, you measure high log write times, then you know exactly what you should do: go look for ways to speed up your log drive(s), or take away the load on the log drives from other processes or queries.
This article introduces some techniques that will allow you to pinpoint exactly where the performance issues are in your system, so you'll know exactly where to spend your time (and money) in solving them.
The YAPP Method
A long time ago in a galaxy far, far away a Dutch guy named Anjo Kolk wrote a paper called YAPP: "Yet Another Performance Profiling Method". The idea behind YAPP is simple, but powerful:
Response time = service time + wait time
In other words, you either work or you wait for a resource to become available. Even 12 years ago, when Anjo first developed the method, this was not a new idea, since this is part of basic queuing theory that many of us should know. The other key idea behind YAPP is that, when optimizing, you should start with the largest time consumer – this principle is also based on an old (Amdahl) law. What was new was that Anjo showed how to apply this principle to working with databases (he originally developed the method for Oracle), using wait events and CPU statistics.
In the Oracle world, YAPP is now a generally accepted way of looking at performance, with many tools and products that use the ideas behind the method.
NOTE:
The YAPP paper can be found at: http://www.oraperf.com/logon.html?rpage=download.php/yapp_anjo_kolk.pdf. Be warned, though, that it deals exclusively with Oracle.
The good news is that the YAPP method can be used in the SQL Server world too. With SQL Server 2005, Microsoft now documents wait events, and provides access to wait event information, through the Dynamic Management Views (DMVs). Older versions of SQL Server do provide wait statistics through the undocumented dbcc sqlperf(waitstat) command. However, apart from two smart people in the MS SQL Customer Advisory Team who started to write and present on this subject a couple of years ago (see references), Microsoft never really took the trouble to document or to promote the use of this command. Interestingly enough, most of the articles I've seen so far use wait events almost exclusively for detecting and solving locking and blocking issues. I haven't come across a paper that used them for 'simple' response time or other performance analysis.
In SQL Server2005, wait events are exposed in the DMV, sys.dm_os_wait_stats. This DMV shows the names, counts, and wait times of wait events encountered by the SQL Server engine, or to be exact the SQLOS. The SQLOS is a layer within SQL Server that, among many other things, takes care of scheduling workloads on worker processes. In SQL Server 2000 and before, this was done via the UMS, the User Mode Scheduler. This is now an integrated part of the SQLOS (see references for SQLOS and UMS, Slava Oks and Ken Henderson).
One column of sys.dm_os_wait_stats needs a little extra explanation: signal wait time. This time represents the time that the actual wait event finished, and the time the task is scheduled to run on the scheduler again. On busy schedulers this signal wait time can be an indication of CPU pressure.
Unfortunately, SQL Server only maintains wait event data at the server level. Wait events are also exposed in the DMV, sys.dm_os_waiting_tasks, but only for the duration of the wait event, which is in many cases just milleseconds (unless you ran into severe locking problems). In addition, to using dm_os_wait_stats, alternative and interesting ways of looking at live systems, can be sampling of dm_os_waiting_tasks or joining against dm_exec_sql_text or dm_exec_sql_plan, using task_address, to get complete overviews of which queries and plans cause possible excessive waits.
Performance diagnosis in SQL 2005 with wait event and CPU data
Hopefully this example will demonstrate the power of wait events combined with CPU data. Two stored procedures are used to collect wait event and CPU data. You can access the scripts to create these procedures from the links below, or from the "Code Download" link at the top of this article. These stored procedures take snapshot copies of sys.dm_os_wait_stats and sys.dm_exec_sessions. At the beginning of a test workload you execute begin_waitstats, and after the test workload is finished you execute end_waitstats. The end_waitstats procedure outputs the difference between the starting and ending snapshots.
The code to generate the workload is as follows:
SET nocount ON EXECUTE begin_waitstats GO BEGIN TRANSACTION DECLARE @rows INT DECLARE @row INT DECLARE @count INT SELECT @rows = 100000 SELECT @row = 0 SELECT @count = 0 WHILE @row < @rows BEGIN INSERT INTO t100k ( c2 ) VALUES ( REPLICATE('a',100) ) SELECT @row = @row + 1 IF @count > 100 BEGIN COMMIT WORK BEGIN TRANSACTION SELECT @count=0 END SELECT @count=@count+1 END COMMIT WORK GO EXECUTE end_waitstatsThis code comprises a simple loop that creates a table and inserts 100,000 rows into it, committing every 100 rows. Note that you end your test workload with a GO. I found that the data that feeds the sys.dm_exec_session view is updated only after the batch is finished.
While executing this loop, I have an IOMeter (see references) program running that is generating 8K random reads on the transaction log disk belonging to the database in which the t100k table lives. It is running at full speed, with no queue and no pause between reads. This generates about 150 reads/sec on an idle system. This is all run on the same single CPU box on which SQL Server is running, with one SQL Scheduler.
The output of this query looks as follows (for clarity, I omitted non-relevant data)
wait_type waits wait_time signal_wait_time ----------------------- -------------------- -------------------- --------------------ASYNC_NETWORK_IO 589 150 10WRITELOG 998 18317 10 session_id cpu_time tot_sched_time elapsed_time ---------- -------------------- -------------- ------------ 53 2123 2322 20669 NOTE:You can use the documentation in Books Online, SQL Server Language Reference: http://msdn2.microsoft.com/en-us/library/ms188754.aspx to find out the meaning of the above wait types.
What you can see here is that this query had an elapsed time (response time) of 20669 milliseconds (all times are in milliseconds). It spends 2123 ms burning CPU cycles so, according to the R=S+W formula, for the rest of the time it must have been waiting.
As you can see, the majority of the wait time is consumed by a wait type called WRITELOG. This is the time spent waiting for log information to be written to the transaction log file. The count ('waits' column) is equal, more or less, to the number of rows we inserted in the loop.
The other wait, ASYNC_NETWORK_IO, is caused by the SQL Server client program dealing with commit feedback; SQL Server needs to wait for the client to accept the data. If you look at the wait time for this event, it's very small and insignificant for this demo.
Now if you add up the (CPU) service time of 2123 and the wait time of 18317+150, you end up with 20590 ms, which is pretty close to the 20669 response (elapsed) time, taken from sys.dm_os_exec_sessions.
The average wait time for the WRITELOG wait event is 18317/998= 18ms. This is good to know, and we will use that as a reference for the next example, where we will 'optimize' the transaction log write performance
In this example, we execute the same loop, with IOMeter running the same load of around 80 random 8K reads per second on the same disk transaction log disk, but this time every read is delayed for 10 ms. This gives more headroom for the Logwriter to do its job. This is what happens to the times:
wait_type waits wait_time signal_wait_time----------------------- -------------------- -------------------- ----------------ASYNC_NETWORK_IO 586 120 0 WRITELOG 998 7841 10 session_id cpu_time tot_sched_time elapsed_time ---------- -------------------- -------------- ------------ 53 2453 2288 10464What you see here is that the wait time for the log is reduced to 7841 ms, and the CPU time is relatively unchanged at 2453 ms. The total elapsed time is 10464 ms.
You see that the times don't exactly match. This trouble is, on this x86 box, the precision of the Windows timing is 10 ms, so this introduces all kinds of measurement errors. But in most cases you will see that this is within the 10% range. Even here you can see that the time this session was on the scheduler doing work (2288 ms) is more than the CPU use time, which shouldn't happen.
Anyway, the average wait time is now back to almost 8 ms per WRITELOG, so we did a pretty good job optimizing. What counts for the end user is, of course, the response time, which we've reducded to 10 seconds, compared to 20 seconds previously.
If we take out the IOMeter load completely, this is what we see:
wait_type waits wait_time signal_wait_time ----------------------- -------------------- -------------------- --------------------ASYNC_NETWORK_IO 598 70 0 WRITELOG 998 160 0 session_id cpu_time tot_sched_time elapsed_time ---------- -------------------- -------------- ------------ 53 2293 2245 2584 Hardly any wait time, mostly CPU and a response time of 2.5 second. So there's your time!
The great thing about these wait event statistics and CPU time measurements is that it takes the guessing out of the game. If you can measure what your application is doing with your system, then you can act accordingly.
For instance, if your SQL Server data is waiting for IO (which might be something like PAGEIOLATCHX waits) 90% of the time, and is only on the CPU 5% of the time, then buying a bigger box with the fastest CPUs won't achieve anything: you need to speed up IO response times, or reduce IO.
In our example, I tried to show that if you measure high log write times, then you should go look for ways to speed up your log drive(s), or take away the load on the log drives from other processes or queries.
As I mentioned at the start, measuring what is happening is always the best course of action. Don't rely on cache hit ratios, or best practices, or worst of all, guesswork.
Some problems and pitfalls
One of the biggest problems, I think, is the fact that the statistics are collected and exposed 'server wide' (technically they are collected per SQL Scheduler, but not exposed). This means you can only use them to say something sensible about resource utilization and response time composition on a server-wide basis. This is simply not enough, unless you have the luxury of testing your application and SQL statements on an isolated server, as in our example. But, of course, it's often hard or impossible to isolate and replicate production problems on an isolated test server.
What you really need is a "per session" or even "per statement" resource (wait and CPU usage) breakdown. Although I think it's very easy for Microsoft to implement things like this, they simply don't do it.
Another issue is that there can be quite a bit of asynchronous work going on in SQL Server, something that the Oracle world doesn't suffer from because of their process based UNIX implementation. For example, if you do a select from a table returning row data to a client, SQL Server can asynchronously scan your table, process the data, issue more I/O's and simultaneously send network packets to the client. This makes the R=S+W method slightly more difficult to use with SQL Server than it is with Oracle.
Getting "per session" stats out of SQL 2000
In the past, I have hacked into SQL Server to collect the statistics I needed, per user and per session, and performed session tracing including sql-statements, batch statistics and wait events. The collection and presentation are done by external stored procedures. I still have a small website up (http://www.sqlinternals.com/) where you can see examples, a presentation and a paper on the techniques I used, along with download code to test them yourself on SQL Server 2000.
WARNING:
My tools come with a big disclaimer: the code is based on call replacing at the machine code level, which can be very tricky and is, of course, totally unsupported in a production environment.
However, just to whet your appetitive for the sort of power you gain from being able to measure at the session level, consider the following example of what these SQL 2000 tools can do. You can pick any session (by spid), and show the wait event and CPU statistics; even for Parallel Queries it will show a breakdown per Execution Context.
A user session, executes a script that contains one CPU intensive query and one physical read intensive query is ran on a 100Mhz CPU machine (100Mhz?! yes, that old slow stuff is still great for CPU related testing purposes). There is no concurrent work going on.
The response time for this script is 160 seconds. Uisng my per session tools, you can see exactly where those 160 seconds were spent:
Spid EC WaitDesc Time(ms) Count WaitSignalTime(ms) ----------- ----------- ------------------ ----------- ----------- ------------------ 55 0 CPU 146699 499 0 55 0 PAGEIOLATCH_SH 13101 483 173 55 0 PAGEIOLATCH_UP 20 2 0 AvgWaitTime(ms)---------------293.9859627.48240110.0The CPU time is about 146.7 seconds, and the wait time for physical I/O (PAGEIOLATCH_xx represents physical I/O) is around 13.1 seconds. Once you know that the major part of the response time for this user consists of CPU time then you can see immediately that upgrading CPU (speed) might help.
Following are the results obtained by doubling the CPU speed (200 MHz) and running the same script again:
Spid EC WaitDesc Time(ms) Count WaitSignalTime(ms) ----------- ----------- ------------------ ----------- ----------- ------------------ 55 0 CPU 73579 522 0 55 0 PAGEIOLATCH_SH 15706 498 100 55 0 PAGEIOLATCH_UP 28 2 0 AvgWaitTime(ms)---------------140.9559331.73895614.0CPU time is almost halved, as expected since we doubled the CPU speed and the wait time for physical I/O is about 15.7 seconds. The overall response time is down to 90 seconds.
Enabling a basic wait event trace produces the following output:
Startbatch tim=3433161, tid=0x43c, spid=51 ecid=0 user: 333 krnl: 69 ticks: 268470845SqlExecute tim=3433162, tid=0x43c, spid=51, ecid=0, len=176, Stmt=SELECT COUNT(*) FROM t1 a INNER LOOP JOIN t1 b ON b.c1 = a.c1 option (maxdop 1)Waitaftersignal tim=3433197, tid=0x43c, spid=51, ecid=0, WT=0x422, waited=20, sigt=0, res=7:1:15Waitaftersignal tim=3433211, tid=0x43c, spid=51, ecid=0, WT=0x422, waited=13, sigt=0, res=7:1:34Waitaftersignal tim=3433222, tid=0x43c, spid=51, ecid=0, WT=0x422, waited=11, sigt=0, res=7:1:76Waitaftersignal tim=3433231, tid=0x43c, spid=51, ecid=0, WT=0x422, waited=9, sigt=0, res=7:1:17Waitaftersignal tim=3433237, tid=0x43c, spid=51, ecid=0, WT=0x422, waited=5, sigt=0, res=7:1:74Waitaftersignal tim=3433248, tid=0x43c, spid=51, ecid=0, WT=0x422, waited=8, sigt=0, res=7:1:27Waitaftersignal tim=3433257, tid=0x43c, spid=51, ecid=0, WT=0x422, waited=9, sigt=0, res=7:1:90..etc...Waitaftersignal tim=3442799, tid=0x43c, spid=51, ecid=0, WT=0x422, waited=14, sigt=0Waitaftersignal tim=3506860, tid=0x43c, spid=51, ecid=0, WT=0x422, waited=16, sigt=0, res=2:1:75Waitaftersignal tim=3506865, tid=0x43c, spid=51, ecid=0, WT=0x423, waited=4, sigt=0, res=2:1:2Batchsummary tim=3506866, tid=0x43c, spid=51, ecid=0, user=72394, krnl=56, ela=73705EndBatchOrSubproc tim=3506866, tid=0x43c, spid=51, ecid=0, (totThread:) user=72727, krnl=125TotIOForBatch(Spid) tim=3506866, tid=0x43c, spid=51, ecid=0, PIO=80, LIO=51527The SqlExecute line shows the query being executed. Each wait event generates a line with a wait type and an elapsed wait time. When the statement is finished, it's easy to see the CPU consumption of 72727 ms, which can be attributed fully to the LIO count: the statement generated a huge amount of logical I/O, out of the buffer cache I/O's, which consume only CPU cycles.
I hope this at least gives you a feel for the potential power of these techniques. I do have a version for the first SQL Server 2005 release, but I haven't spend much time developing it, and bringing it up to the same level as the SQL Server 2000 code, so it's not on there (yet?).
Summary
Despite the fact that DMVs supply only server-level (and sometimes database-level) statistics, and don't drill down to the session level, they are still a very useful tool for performance profiling and diagnosis. Other interesting scenarios are parallel queries where multiple execution contexts are working for one SPID or session in SS2005. In that case you can not simply add all the wait and CPU times together and match with the response time, but you can add times at the Execution Context level.
In a next article I will show some more examples of dealing with different wait events and how to interpret them. Both SQL Server 2000 and 2005 will be addressed.
References and further reading
Wait events
Microsoft SQL Server Development Customer Advisory Team:
http://blogs.msdn.com/sqlcat/default.aspx
Unfortunately the two guys, Gert Drapers and Tom Davidson, who published and presented on the wait event subject have both moved on to other teams. Gert has some presentations available on his website: http://www.sqldev.net/
Here also has a very good presentation on the subject and describes a lot of SQL Server 2005 wait events here: http://www.microsoft.com/technet/prodtechnol/sql/2005/tsprfprb.mspx
SQLOS
Slave Oks Blog (where I just read he left his team also!): http://blogs.msdn.com/slavao/
Slava has some very good papers on the SQLOS subject, mostly focusing on memory management, but also on the scheduler. He also wrote excellent chapter in a new book edited by Ken Henderson: SQL Server 2005 Practical Troubleshooting. The same book has a very good chapter on SQLOS and scheduling issues, by Sameer Tejani, and a chapter called 'Waiting and blocking issues' by Santeri Voutilainen.
Ken Henderson also wrote 'The Guru's Guide to SQL Server: Architecture and Internals'. It is a bit of a strange book in my opinion, which probably should have been two books I think. The first half deals with SQL Server 2000 Internals very well, but the seconds half deals with all kinds of subjects, on a more superficial level. Some of the chapters of this book are available on MSDN. I am looking forward to his SQL Server 2005 version.
IOMeter
IOMeter is an IO stress and measurement tool developed by Intel. It is now an Open Source tool, and freely downloadable from http://www.iometer.org/.
From: http://www.simple-talk.com/sql/performance/sql-server-wait-events-taking-the-guesswork-out-of-performance-profiling/
Red Hat / CentOS Install nginx PHP5 FastCGI Webserver
Did this a while ago by compiling source but now I need to reinstall it.
following is a good reference and easy to follow:
http://www.cyberciti.biz/faq/rhel-fedora-install-configure-nginx-php5/
by the way, nginx performs much faster than apache.
following is a good reference and easy to follow:
http://www.cyberciti.biz/faq/rhel-fedora-install-configure-nginx-php5/
by the way, nginx performs much faster than apache.
Thursday, April 7, 2011
create drilldown through SSRS report based Parent-Children Dimension
A few notes:
Group expression: =Fields!Employees.UniqueName
Parent group expression: =Fields!Employees.ParentUniqueName
TextBox alignment: Padding-Left=Cstr(Fields!Employees.LevelNumber*20) & "pt"

Group expression: =Fields!Employees.UniqueName
Parent group expression: =Fields!Employees.ParentUniqueName
TextBox alignment: Padding-Left=Cstr(Fields!Employees.LevelNumber*20) & "pt"

Tuesday, April 5, 2011
Deploy Office 2007 VSTO solution using Windows Installer
Using ClickOnce installation sometime can be quite cumbersome, especially when combing with document-level application and customized file type.
To simply the deployment, using windows installer project will definitely worth the effort.
namely, a few things that you might miss out:
> include project output then .vsto, .manifest seperately.
> add a custom action project (installer class) to update customization manifest (_AssemblyLocation), you need to use ServerDocument class to achieve this.
> append '|vstolocal' to the manifest location:
ServerDocument.AddCustomization(
targetLocation,
assemblyLocation,
SolutionID,
deploymentManifestLocation,
true,
out nonpublicCachedDataMembers);
references:
Deploying a Visual Studio Tools for the Office System 3.0 Solution for the 2007 Microsoft Office System Using Windows Installer
http://msdn.microsoft.com/en-us/library/cc563937.aspx
Deploying an Office Solution by Using Windows Installer
http://msdn.microsoft.com/en-us/library/cc442767.aspx
How to: Attach Managed Code Extensions to Documents
http://msdn.microsoft.com/en-us/library/bb772091.aspx
How to: Create and Modify Custom Document Properties
http://msdn.microsoft.com/en-us/library/dhxe2d75.aspx
How to: Change the Installation Path of an Office Solution
http://msdn.microsoft.com/en-us/library/bb608626.aspx
Monday, April 4, 2011
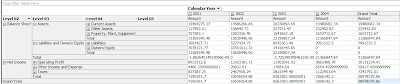
Financial Cube notes
Finance Cube, By Accounts aggregation
1. Include Account-key, parent Account-key, account type as attribute while designing account dimention.
2. assign each attribute correct type under accounts or via define Accounts intelligence to the dimension.
3. add unary operator to account dim via adding BI tool or manually
4. Edit databases to do account type mapping.
5. change the AggregateFunction of amount measure to 'ByAccount'.

Sunday, April 3, 2011
web service proxy class and xml serialization
web service proxy class and xml serialization
http://dotnetslackers.com/Community/blogs/kaushalparik/archive/2010/05/14/how-to-call-invoke-a-web-service-without-adding-web-reference.aspx
XML Serialization in the .NET Framework
http://msdn.microsoft.com/en-us/library/ms950721.aspx
http://dotnetslackers.com/Community/blogs/kaushalparik/archive/2010/05/14/how-to-call-invoke-a-web-service-without-adding-web-reference.aspx
XML Serialization in the .NET Framework
http://msdn.microsoft.com/en-us/library/ms950721.aspx
Cannot reinitialize subscriptions of non-immediate_sync publications.
while I was trying to solve the above issue, I came across to this useful page:
http://ashwin4all1.wordpress.com/2009/06/11/replication/
Thanks for sharing~
http://ashwin4all1.wordpress.com/2009/06/11/replication/
Thanks for sharing~
Subscribe to:
Posts (Atom)
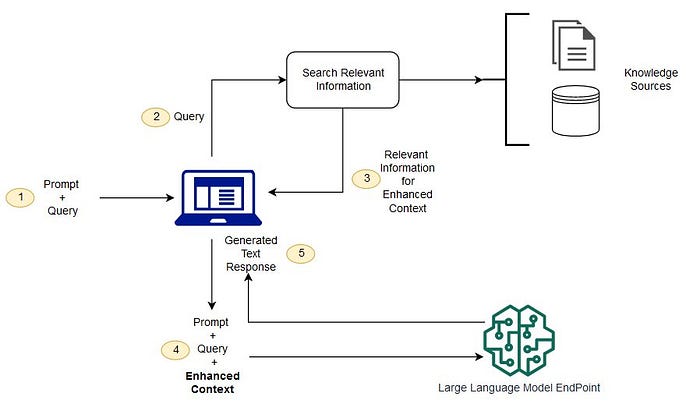
Elevating LLM Deployment with FastAPI and React: A Step-By-Step Guide
In a previous exploration , I delved into creating a Retrieval-Augmented-Generation (RAG) demo, utilising Google’s gemma model, Hugging ...